background image

background image

Description

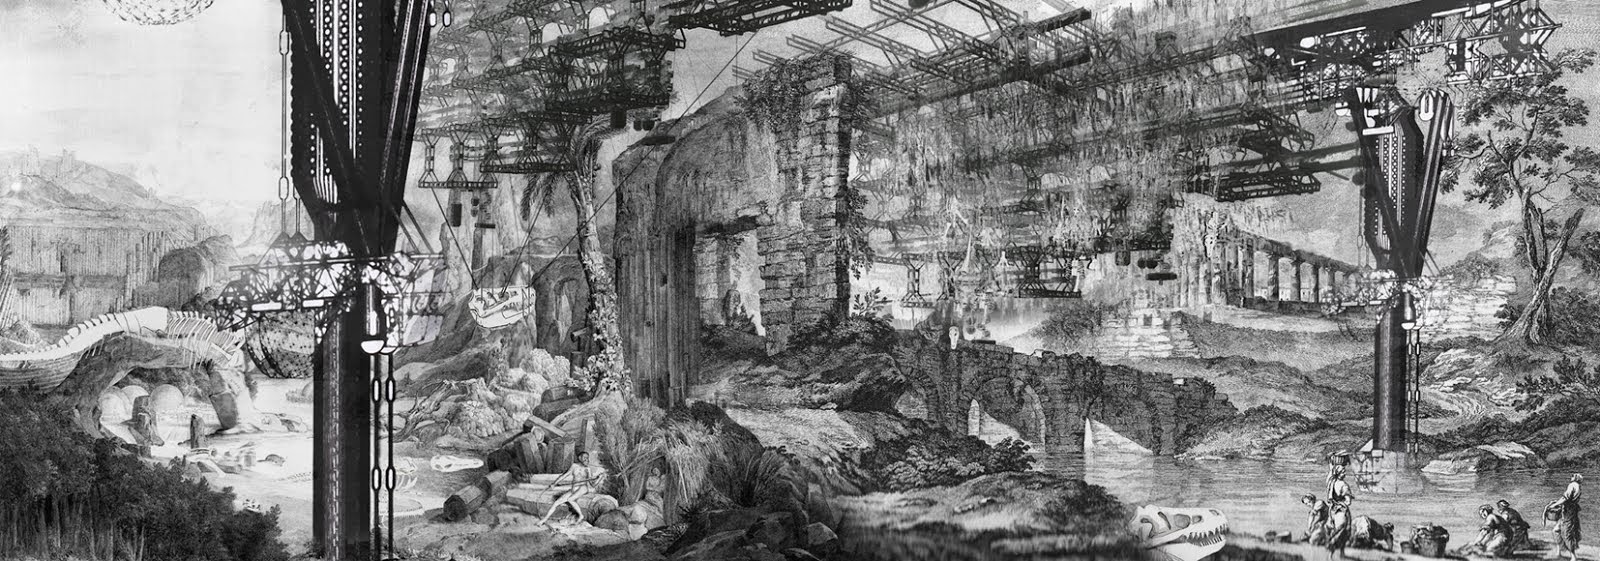
The Industrial Revolution pushed civilization forward dramatically. The technological innovations achieved allowed us to build bigger cities, get richer and construct a standard of life never before seen and hardly imagined. Subsequent political agendas and technological innovations have pushed civilization up above Nature resulting in a disconnect. The environmental consequences though are leaving the Earth moribund. In this blog, I'm exploring the idea that integrating computational technology into environmental systems will be the answer to the aftermath of industry.

Above drawing is by Phung Hieu Minh Van, a student at the Architectural Association.

Tuesday 29 October 2013

Thinking roads part 1.

Gone are these days ....


The first time a road was paved was in Egypt sometime around 2600 and 2200 BC. Since then they have played a central part in civilization. However, this current decade is witnessing a major milestone for this form of public infrastructure. Going are the days when the road was a passive tool, something that we operate on. Soon, roads will be something we operate with.


The degree to which road have aided society and changed history and geography is almost immeasurable and is not the main subject of this post -  how we are making them better is.

The annual cost of traffic congestion to the US economy is estimated to be in excess of $100 billion. That's almost as much as the GDP of Morocco. On top of this, in the US more than 40,000 people are killed in road traffic accidents annually and 5 million are injured. This is in a country that is not dealing with the rapid urbanisation that is being experienced in the developing world.

Evidently then there is huge scope for improvement for the operation of road infrastructure systems. Computational technology can help us solve this problem. We can create and deploy technology at a range of spatial and temporal scales to drastically improve the capacity of existing infrastructure through improvements to its operational efficiency. In doing this we can reduce the burden on the environment and energy sources. We can also make the roads safer. 

Lots of cities the world over are employing systems of this type. The market leader in implementing them is IBM which has or is building them in lots of cities and countries including in Dublin, Boston, Vietnam, the Ivory Coast and Los Angeles. As well as this lots of companies are now developing systems and programs to allow individuals to directly access and contribute data for this. One such company is Waze, bought by Google in June for $1.3 billion.

One of the first adopters of an integrated, real-time traffic coordination system was the U.S.. In 1991 Congress launched their Intelligent Transportation Systems (ITS) program to consolidate information, and automate highway technology. It consists of an extensive network of sensors and communication devices lining the roads. Interestingly this system was initially developed well before the internet took off. Today vehicles too communicate information to the network. With this information the system spews out pre-emptive signalling control and electronic route guidance. As this systems becomes increasingly advanced the highways are becoming essentially automated. Thus the roads will know their own operational status.

More recently Dublin have adopted a similar system. The council here commission the IBM road and traffic department to employ their system to assemble real-time data coming from a wide range of sources including road sensors, video camera and GPS updates from the city's 1000 buses. Naveen Lamba of IBM's Smarter Government team had this to say:

"A big part of our solution is the predictive element. You can influence the outcomes as opposed to reacting to what's happening out there".

This type of thing though is not restricted to the realms of developed countries and wealth city councils. Da Nang, a city in Vietnam, has just signed an agreement with IBM to intelligently manage its water and transportation infrastructure.

Da Nang is the country's biggest port and 4th largest city with a population of 890,000. It is also the area of the country's fastest growing urban sprawl. It provides a useful comparison to similar cities in neighbouring China that have experienced so much growth over the last decade. The contract with IBM is great evidence that the local council doesn't want to mirror that environmental impact urban growth has had in China. IBM is being paid to make sure the city turns into one of its smarter cities.

In both Dublin and Da Nang IBM's work is characterised by a deep integration of computational technology with the environment and the legacy infrastructure. A huge amount of software and a huge number of sensors are being embedded into public transport, roads and motorways. Using this information, computers can then optimise traffic flow and this minimise car congestion. Da Nang has only 100 buses but the council believes that by employing IBM's system and other effective management schemes this will be enough for its almost 1 million inhabitants.

The technology required to do all this is significant. The optimization problems needing to be solved pose great analytical challenges. Nevertheless, computers are getting more powerful, and most importantly cheaper, so councils and government of all shapes and sizes should be able to afford them. This should revolutionise public infrastructure.

Interestingly, very recent software and hardware advances integrated into the vehicles themselves have progressed to such an extent that they are now driving themselves better than they are by humans. The idea that a more advance version of autopilot would be developed is not a new idea but it is now becoming a reality. However, its interesting to compare all these developments with air traffic control. Despite all these huge advantage in technology a significant component of air traffic control is still done by human employees. 
Famously too give computational technology in life-controlling situations has ended badly, video here.

This is a really interesting time for the development of these technologies in the context of climate change and the rapid urbanisation that much of the world is experiencing.

This is the first part of this post. In the second part (which hopefully I'll put up on Friday) I'll use real-time, publicly available data from the UK government's data.gov.uk website to plot real-time conditions of road in the British Isles. This data is derived from automated number plate recognition systems that track cars driving on the British road network. 

 Coming are these days......


***************************
As always, please leave comments, suggestions, questions etc.
Tuesday 22 October 2013

Data assimilation


This post is going to be about 'fleshing out' data we have. What I want to illustrate by writing it is that once we've collected information we can use it to get better information. This is really vital to using it effectively to draw meaningful conclusions. There are two ways to do this: 1) Looking between data we know and 2) Using what we know about the relationship between variables to infer more information.

Imagine we took a walk. We recorded the altitude along the way: at the start, in the middle and at the end. At the start of the walk (A) we measured the altitude to be 5 units. In the middle of the walk (B) we measured it to be 0 units and at the end (C) we measured it to be -5 units. We have some useful data about the path we've travelled. What if we want to know what the shape of the land surface we walked through was(without taking a measurement at every point)? To do this we can use some maths. We can interpolate between and around these points to get an idea of what it might look like. We can the take an informed guess at the value we would have measured at some other point, say D. Here's a cartoon of the walk we just took:


In the plot below I've used an interpolation method to do just this. The colour of the dots A, B, and C represents the altitudes we measured on our walk. The colour of the surface is the interpolated landscape. It uses the information we know, i.e. the altitude at points A, B, and C. and the distance between them to fill-in the gaps. The point in the middle is our unknown-altitude point D. Our model here suggests that if we had walked to point D and taken a reading the altitude would most likely be close to 0 units (shown by its colour).  


The picture will be different if we collect more points along the away. For example if we had taken a detour between A and B and found the altitude at this new point to be 3 units. Then it we interpolate through these points we get a change in the landscape but here it is still likely that our point D is around 0 units. 


The picture though can change dramatically if we take more points. Say we took the altitude at home just before we started the walk (the point in the top-left-hand corner below) and measured it as -5 units. Our interpolated, general picture of the landscape changes a lot very quickly. Now point D is more like 4 units than 0.


This general method for using the data we have for interpolating for data we don't have is crucial. With it we can make much better use of the information available to us. It does however assume that we know nothing about the context of the data. Say, for example we know that any land at an altitude of -3 units is always unstable so cannot exist. Then we know something about the system we are collecting data in. Having this information often allows us to make much better guesses at the values we haven't recorded. Using this information is the process of modelling.

For an example let's take Isaac Newton's second law of motion with acceleration as the subject:

Acceleration = Force/Mass
             
This relation says something about the way changes in the forces acting on an object and the object's mass will effect its acceleration. We can use this to predict what the acceleration will be for any given force. So we can use information we collect, say about the acceleration of a car and its mass, to infer the force acting on it. This is a very simple example of a model.

When we build up very detailed models they can be extremely useful. For example, complicated models have been developed to predict the weather. They work on exactly the same principles as the simple example above. The most powerful versions of these models are called General Circulation Models and are many tens of thousand lines of computer code. These are what weather forecasts and climate change research use.

The most advanced method of data assimilation involves one more step. It takes into consideration one of the most important and fascinating discovery of maths of the last 100 years. In fact it was discovered by a meteorologist! Edward Lorenz. He noted that the equations that govern climate, i.e. the known relations that we are using in our models, are incredibly sensitive to the data we are putting in at the start. Even a minor change will result in a dramatically different outcome. In fact the uncertainties inherent to our data collection process make this a really significant consideration. Not only is recording data difficult, making a note of the exact value of some condition (for example temperature at the top of Gower Street) is impossible! The equations we are using are so sensitive that the number of decimal places required to get the exact value is infinite. We can't even measure it exactly let alone write it down! So, to take account for this an ingenious method has been developed. This is the last thing I going to write about in the context of data assembling.

Instead of giving up saying that we can't predict anything because of Lorenz's chaos we collect our data as accurately as possible and then make lots of little changes to it. These are called perturbations. This way we have a better idea at what the actual value (of say temperature at the top of Gower Street actually was). We put all these sets of data through our model to look at the range of outcomes and how much these differences actually matter. If we want we can then take the average of all these results to get a probability forecast rather than the deterministic one we would have if we used only one set of data.

The plot below, taken from some research I did over the summer, shows exactly this! The navy blue line starting off the East coast of Africa is the actual path of Hurricane Bill in 2009. All the other lines are forecast tracks. That is they are informed guesses at where Hurricane Bill might have gone based on information collected when the Hurricane was just north of the Caribbean. As much data as possible is collected and then it is changed a little bit, lots of times, exactly as described above, until there are 51 sets of perturbed data and the model is run for each one. The profound effect of all these changes, and the sensitivity of the model to the input data, is shown really nicely in this plot by the spread in the hurricane tracks. Some find Bill going towards Spain and some find Bill going north of Scandinavia.


 Again, so what's the point of me writing about this? The point is that not only do we now have the ability to record and store more information than ever before. We also have the ability get more out of it. These techniques that I've described are fundamental to using data. The first method, interpolation, is really useful but it is limited. We can only look between the data points we already know - we can't extrapolate. The second method of modelling is extremely powerful. Our ability to run good models depends a lot of the computers we have. These are getting more and more powerful. Our models are getting better and better. This should (and it is) be a major area of focus, research and investment.

Hopefully now I've described effectively the process of data collection and assimilation. I also hope I've highlighted how uniquely positioned Society now is in terms of knowing what has happened, what is happening and what might happen in the future. The benefits of integrating and operating systems to monitor the globe, to store and assimilate this information are myriad and profound.
  
For my next post I'm going to look into physical engineering structures that don't passively observe but rather actively engage with, use and control their environment.


############################
I've posted the code I wrote for the above interpolation examples at: http://herculescyborgcode.blogspot.co.uk/2013/10/data-assimilation-interpolation-example.html

Like always please leave comments, suggestions or criticisms below or email them to me. I really appreciate this.


Tuesday 15 October 2013

The eyes and ears of corn


This is a plot of tropical storms. Every tropical storm that occurred in the Northern Hemisphere between 2008 and 2012. On the far left is continental Europe (you can easily make out Italy), in the middle is the Pacific Ocean and on the far right you can make out Greenland, Iceland and the UK. Instead of plotting the storms as tracks as is normally done I've plotted them as points to show the density of storm activity. For some storms its possible to easily make out the tracks as the points line up in clear paths where there aren't many other points, for example over Canada. The different colours show the basins in which the storms started out in, for example red represents all the storms with their genesis in the North Atlantic. Its simple enough to understand this picture however the amount of organization, observation and data processing required to get this data is quite amazing. This post is going to be about human monitoring of the environment and our attempts to model its processes.

Keeping a record of things happening is very useful. This was recognised very early on in human history. Some of the earliest forms of the written word were pictorial representations of animal stocks and plant locations. Unfortunately, technology for a long time did not afford us the opportunity to keep records without huge vulnerabilities. Early archives were kept by the ancient Chinese, Greek, and Roman civilizations but little of these survive today. Thanks to good data collection, archiving, the emergence of computational technology, hard-drives and the application of statistics (in particular the methods of Thomas Bayes) we are now harnessing the huge power of stored information.

Monitoring the natural world has lots of advantages. Doing so allows us to plan for the future, deal with problems as they arise, tune performance, track expectations and study the environment. Collecting all this information in archives makes it even more powerful. The difficulty though is not so much the actual monitoring process but is rather knowing what should be monitored. Planning, implementing and running monitoring systems is expensive and collecting data that is superfluous also results in unnecessary costs and is unwieldy. So, there is an important question of what to monitor and how often it needs to be recorded. 

Physical environmental variables are fairly simple to pin down. We need to record temperatures, pressures, humidities and the like if we want to know how the weather works and interacts with nature and civilization. Other variables are not so easy to pick out. Generally it is the case that a research field or commercial application will require data on a variable, for example information on forest fires, and then collect it themselves or commission some-one to collect it for them. Not the other way around.

It is also the case that what we can measure and what we want to measure is different. For example, satellites orbiting the world can measure all sorts of things one of which is photosynthesis in plants. But there is nothing actually being sent out by the process of photosynthesis that is directly seen by the sensors on the satellite. So we can develop methods to use information that is picked up by the sensors (i.e. photons of electromagnetic radiation) orbiting Earth to infer information that is useful for other purposes (e.g. using photosynthesis rates for ecological research). 

Broadly, environmental monitoring programs can be split into 2 categories: remotely sensed data and in-situ data collection.
  
Remote sensing is 'the science, technology and art of obtaining information about objects or phenomena from a distance (i.e. without being in physical contact with them)' (definition from Dr. Mat Disney). It is an incredibly useful method of observing the Earth (and elsewhere too). The technology of remote sensing has its roots over 150 years ago with the invention of the camera. The first person to take an areal photograph was a Frenchman called Gaspard-Felix "Nadar" Tournachon. He went up in hot-air balloons tied to buildings to take photos of houses. For a long time, information garnered from remotely sensed images was limited to qualitative information only. As digital sensors improved and satellites were launched concrete, quantitative information could be derived from these images. 

Modern remotely sensed images can give us information on meteorological, geo-physical, biological, social, chemical and political variables that can be used for all sorts of things. For example, information collected by the American National Oceanic and Atmospheric Administration's (NOAA's) satellites is used in operational weather forecasts and scientific research globally. I've produced this animation of global temperature maximums for every 6 hours in the year of my birth 1992. The data is from NOAA's 20th century reanalysis.


On the ground however we can build up a different picture. Electronic, automated data loggers can record information for a range of variables from environmental variables such as temperature and pressure to social variables like road traffic and noise levels. These loggers can be integrated into wireless networks pretty simply and information recorded can be stored and transmitted around the world (Akyildiz et al. 2007). For example, there are networks of tethered buoys in the ocean that transmit information on swell heights. This information is used for all sorts of things for example tsunami monitoring to other more trivial pursuits.

Despite these monumental opportunities for data collection that technology affords us, constraints remain. Some times people actually need to write things down.

For example automating the monitoring of fauna remains difficult. Individual animals can be fitted with trackers but observing whole populations this way currently remains unfeasible.  Keeping records of vertebrate populations is vital for all sorts of reasons not least for agriculture and environmental management. However, population dynamics are understood to occur at large spatial and temporal scales. Collecting a large volume of data in as close as possible to real-time is a difficult problem. Compromises will inevitably be made but we would like to minimize them. Traditionally the alternative has been using a team of highly educated and skilled researchers to decide on a subset of the population thought be representative of the population at large and to periodically visit the area for data collection. This is fieldwork. We can do better.

Luzar et al. (2011) discuss large-scale, long-term environmental monitoring by non-researchers. They describe a 3-year study of socioeconomic factors, hunting behaviour, and wildlife populations in a 48,000 square-kilometre (about 2.5 times the size of Wales), predominately indigenous region of Amazonia. They found that despite high rates of illiteracy, innumeracy and unfamiliarity with the scientific method, provided the potential of the data was explained and had a clear purpose to those involved, people are likely to engage long-term and collect high-quality data.

Expectations are changing. The reality is that engineers, scientists and managers (including politicians) expect statistically robust and up-to-date data informing their decisions. They are expecting more and more high-quality data. So, we are transitioning from a time when patchy, out-of-date information was put up with as a fact of life to one where it will not be. So, the designers and implementers of environmental monitoring schemes are going from a time when it was preferable to have high-quality data to one where is it a requirement.

So what's the point of all this. Well, today we live in an era when we can not only collect all sorts of information about the natural world and how we are interacting with it (and on it). We can also store all this information, query it and use it. This is really a unique time in human history. 150 years ago the first photo was taken, 100 years ago magnetic storage (the precursor to modern hard-drives) was first properly developed, and in 2001 Google earth went live for the first time bring people satellite data from around the world. At the end of 2014 it might be possible that Google earth is in near real time. Having this data should change the fundamental mechanisms on which society works. We can now continually test ideas, fix problems earlier and track our progress better. This data should be looked after properly. It is the lifeblood of the integrated, physical engineering structures that I will explore latter in this blog.

What I'm really keen to get across in this post is that we now have a phenomenal ability of observe reality. One that has never existed before for civilization. Existing monitoring schemes need to be looked after and new ones built. The data collected should be accessible to all those that might need to without being wrapped up in bureaucracy and politics. Society should also make sure its is able to not only use the data to draw effective conclusions but also be able to enact on what the data is telling us.  

All sorts of constraints exist though. Implementing data collection schemes is costly. The cheapest satellites belonging to NASA or ESA are constructed for around 80 to 150 million pounds. Employing people too is expensive. Data collection and monitoring is also wrapped up in ethical questions of accessibility (should this data be private or public?) and ethics (Is our experience of life on earth detracted from by knowing what is happening everywhere at all times?).  I hope to think about some of these issues in another post.

In my next post will be 'fleshing out' collected data. Even in the most thorough data collection schemes gaps will remain or data will need to be of higher resolution than originally collected for. For this, a mathematical process is used called data assimilation. It involves looking for trends in the data and spotting patterns. Then using these to infer what is happening where data wasn't collected.

**********
Please engage with my writing and leave comments/criticisms/suggestions etc below.

Tuesday 8 October 2013

Prometheus stole fire from the gods and gave it to us mortals, or so the story goes. Was this out of kindness, pity, profound genius and foresight or perhaps boredom? We'll never know. It's an emotive analogy for the Industrial Revolution and one often summoned. Most tellings of this story in this context fail to recount what happened after the great gift however. Zeus, the king of the gods, was so infuriated that he strapped Prometheus to a rock and had an eagle come every day to peck out his liver. Overnight the very same liver grew back. This too though is a useful story to tell in the context of the publication of the fifth report on the state of the climate by the Intergovernmental Panel on Climate Change (IPCC). As a result of our collective industrial activities environmental systems the world over are reeling. Atmospheric pollution, environmental degradation and growing populations are starting to be felt. We are both Prometheus and the humans to whom he gave fire. We are at the beginning of our first day on the rock. 

The story then goes that Hercules, a demigod and the greatest of Greek heroes, rescues Prometheus. Integration between the natural environment and computational technology is emerging as a potential solution to the resuscitation of the planet.

This technology has two component parts. The first comes in the form of information. Operating within environmental systems is most efficient when we have as much information as possible about what’s going on. Modern technology affords us this luxury. We can now collect and store all sorts of data. We can then use modern high-level programming tools, machine learning techniques and computational and statistical modeling to understand what’s going on. The second component is geoengineering. This is the building of systems and structures to control, or work better with, the environment. Once ridiculed by the Academy as ludicrous and ignored by government as unfeasible, geoengineering is now firmly on the agenda.  

The possibility of a cybernetic environment, that is one characterised by complete integration between artificial constructions and natural systems, has arisen in phase with its acknowledgment, discussion and exploration in literature. It also coincides with, although is arguably lagging behind, a movement away from the canonical Cartesian understanding of systems to one of complexity first introduced as early back as Vico. This is interesting as for the first time in a long time the theory and praxis of many of the disciplines that influence and control society and the human environment, such as the sciences (social and natural) and engineering, are coalescing in their thoughts.

There's lots of discussion within the geographical literature. I hope to discuss this in amongst the more physically bounded explorations in these posts. For example, Maturana and Varela have developed ideas around the sustainability of systems (their so-called autopoiesis), ‘biological stickiness’ or 'love' whereby any two systems upon encountering one another stay ‘stuck’ together’, and the difficulties surrounding the distinguishing of component parts of any system. In the light of technology these raise questions about sustainability and evolution of any implementation of the integration under discussion. For individuals too, social and political issues of autonomy and privacy are rearing. Donna Harraway (1991) first into introduced the 'cyborg' into the social sciences to escape from the constraints of gender and materialism. With bio- and wearable- technology ever pervading, individual integration with society and the environment at large is becoming more and more a commonplace reality. 

The IPCC states that the atmosphere has the capacity to store a trillion tons of carbon without altering the climate too drastically. Anthropogenic activity has already put half a trillion tons up there. The outstanding half a trillion will be produced in the next 30 years at current rates of economic growth. There are two potential outcomes to this situation. One sees civilization rallying globally and reducing carbon emissions in time to prevent any damage to the climate that inhibits us from living on a planet with any semblance of the world today. The other sees the world changing so dramatically that a complete reworking of the social, geographical, economic and political landscapes of today must ensue. Either way, computational technology will have to play a huge role.

Through this series of posts I want to explore the integration of computational technology and Nature on a range of spatial and temporal scales. I'm going to write about environmental monitoring and modeling, geoengineering, technology changing the constraints of geography, the internet of things, the politics of this movement, barriers to integrations and the spaces of technological exclusion all in the contect of environmental change. It may well be that by the time I've finished writing I'll have changed my mind, but for now my advocation is that this integration of technology with Nature, to produce a cyborg or multiple cyborgs, is one of the major solutions to the problems civilization faces.